
Normal IGF-1 by age and sex
The normal range of IGF-1 falls steadily with age in both sexes. Each bar spans the 2.5th to 97.5th percentile of a healthy reference population, with the median marked, from a 15,014-person study.
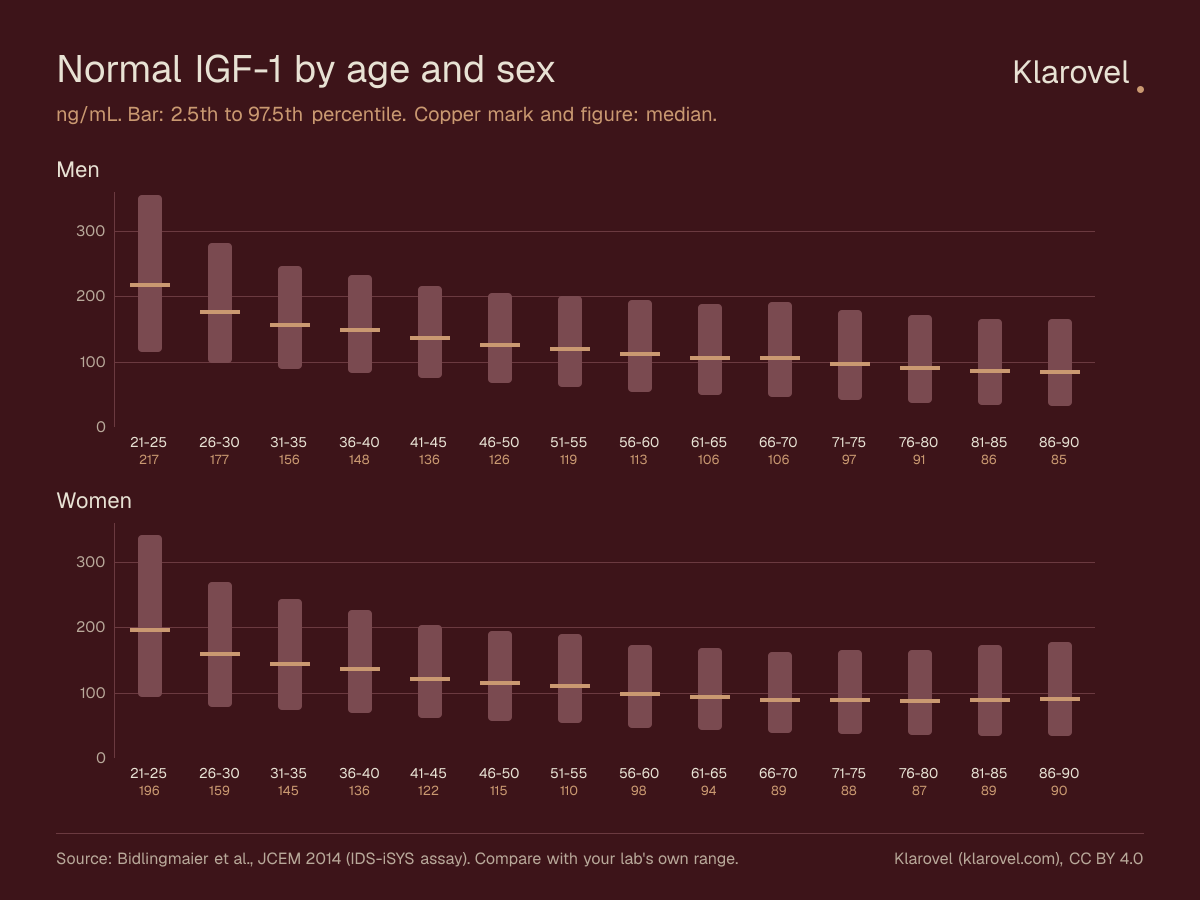
IGF-1 is the usual blood marker for how active the growth hormone axis is, and what counts as normal depends heavily on age. In men the median falls from about 217 ng/mL at 21 to 25 to about 106 ng/mL at 61 to 65; in women from about 196 to 94 ng/mL over the same years. A value that is ordinary at 25 can be well above the normal range at 65.
That is why labs and clinicians often express IGF-1 as a standard deviation score (SDS) for age and sex rather than as a raw number. The bars here span the central 95% of a healthy reference population, which corresponds to an SDS of about -2 to +2.
These reference values come from one assay (IDS-iSYS, calibrated to the WHO 02/254 standard). Other lab platforms give somewhat different numbers, so a result is best compared with the range printed on its own lab report. To convert ng/mL to nmol/L, multiply by 0.131.
| Age | Men 2.5th | Men median | Men 97.5th | Women 2.5th | Women median | Women 97.5th |
|---|---|---|---|---|---|---|
| 18 | 146.2 | 292 | 493.6 | 120.5 | 270 | 485.8 |
| 19 | 140.2 | 276.1 | 462.7 | 114.4 | 252.6 | 450.8 |
| 20 | 133.1 | 258.5 | 430 | 107.8 | 234.8 | 416 |
| 21-25 | 115.2 | 217.2 | 354.8 | 92.9 | 196.2 | 342 |
| 26-30 | 97.9 | 176.8 | 281.6 | 78.4 | 158.7 | 270 |
| 31-35 | 88.3 | 156.4 | 246 | 73.1 | 144.7 | 243 |
| 36-40 | 83.4 | 147.9 | 232.7 | 69 | 135.7 | 227 |
| 41-45 | 74.9 | 135.7 | 216.4 | 61.5 | 121.7 | 204.4 |
| 46-50 | 66.9 | 125.7 | 205.1 | 56.8 | 114.5 | 194.5 |
| 51-55 | 60.6 | 119.4 | 200.3 | 53 | 109.9 | 189.6 |
| 56-60 | 54.3 | 112.5 | 194.2 | 45.6 | 98 | 172.4 |
| 61-65 | 48.8 | 106 | 187.7 | 42.2 | 94.1 | 169 |
| 66-70 | 46.5 | 105.8 | 191.9 | 38.3 | 88.7 | 162.5 |
| 71-75 | 40.9 | 96.7 | 179.2 | 36.6 | 88.2 | 164.7 |
| 76-80 | 37.1 | 91.1 | 172 | 34.7 | 86.7 | 164.8 |
| 81-85 | 33.8 | 86.1 | 165.4 | 34.4 | 89.1 | 172.4 |
| 86-90 | 32.2 | 85 | 166.1 | 33.6 | 90.3 | 177.8 |
Sources
Use this figure
Free to use in articles, course material and reports under CC BY 4.0. Credit “Klarovel” with a link to this page. The credit line is already printed on the image.
Related: All reference figures, including the growth hormone axis
Klarovel does not sell, supply or ship peptides. Nothing on this page is medical advice or a dose recommendation.